


Load a reference in TONAL BALANCE — a previous mix of yours or a commercial track — and VERDICT compares against it as well: its sentences then say which region does not look like the mix you chose as a target. Against your material's own trend it is a blunt instrument; a reference is strictly better.
What TELESCOPE is
Thirteen lenses over one analysis engine, plus a rules engine that turns what it measured into sentences — each one carrying the number that produced it and the id of the rule that fired. And it does not touch your audio: TELESCOPE reads L and R, pushes them to its own analysis thread and writes nothing back — 0 samples of latency, 0 tail, bit-exact output. That is not a claim but a test: deterministic stereo noise through the plug-in with bypass on and off, with each of the thirteen lenses selected, in blocks of 1, 7, 64 and 4096 samples and from a mono source — zero mismatches in all five cases. Analysis runs on its own thread: the audio never waits for a measurement.
What it is not It does not localise sources — FIELD and POLAR LEVEL show energy by pan direction, not localisation: no HRTF, no ITD, no azimuth. It is stereo only, with no speech-intelligibility metric. It runs with no model, no network and no telemetry: VERDICT is a deterministic table of thresholds — measurement, not taste — and no findings is not the same as finished.
Up and running in five steps
Double-click OVNI-TELESCOPE-v0.1.0.pkg. macOS's own Installer puts VST3 + AU where your DAW looks for them and asks for your admin password itself. The package is signed with a Developer ID and notarized by Apple, so nothing lands in quarantine. macOS 11 or newer, Apple Silicon or Intel.
Insert TELESCOPE on the track or bus you want to read, wherever it sits in the chain: the audio comes out bit-exact, with 0 samples of latency.
Pick a lens on the strip on the left. Only the modules the open lens needs are computed — except loudness, which is always on, so the integrated value, LRA, histogram and clip count never have a hole.
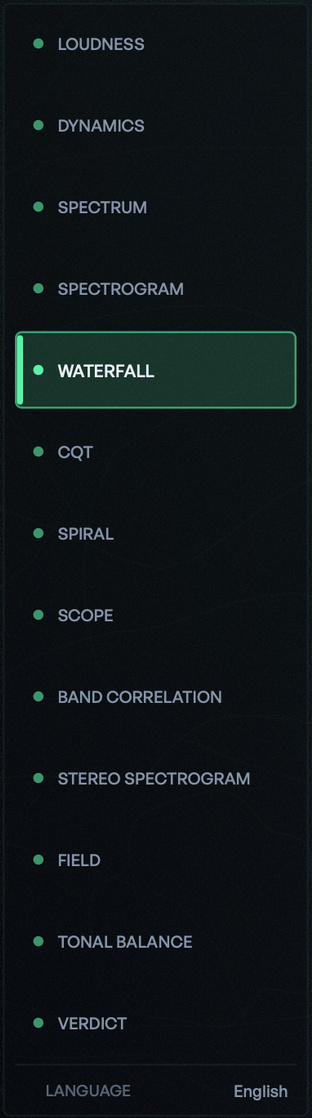
The strip — thirteen lenses, one click each; LANGUAGE at the foot. Hover any plot for a readout, always from the data and never from the pixel colour — where there is no data there is no readout. S · M · L resize the window, and LANGUAGE, at the foot of the strip, switches the whole plug-in.

S · M · L resize the window — each size has its own metrics, not the same drawing scaled. Open VERDICT and read the headline first: the count of what was measured, and where the first thing to look at starts. Re-run the analysis after every change.

The headline counts what was measured and says where the first thing to look at starts. No adjectives.
How the signal moves through it
Inside the plug-in, TELESCOPE reads L and R, pushes them to a lock-free bus and writes nothing back, so it never touches your audio. An analysis thread drains that bus and computes only the modules the open lens needs (loudness, always), publishing frames for the lenses to draw and a per-second history — 10 minutes at 1 Hz since the last RESET — that VERDICT reads to say where. File analysis runs the same classes offline and comes out equal to the bit.
Highlighted: the analysis thread. The audio is not a stage of this chain — TELESCOPE reads it and writes nothing back: 0 samples of latency, 0 tail, bit-exact output. Only the modules the open lens needs are computed; loudness is always on.
Every control, explained
01 · How loud

LOUDNESS
How loud the programme is, to the broadcast standard — integrated, short-term and momentary LUFS, LRA and true peak, also per channel.
INTEGRATED follows ITU-R BS.1770 with its double gate (absolute −70 LUFS, relative 10 LU below); MOMENTARY is a 400 ms window and SHORT-TERM a 3 s window at 10 Hz; LRA follows EBU Tech 3342; TP MAX is the true peak of BS.1770 Annex 2, and L / R give it per channel. Four bars share one 0 … −60 scale; while a window is still filling, the bar shows the partial value, dimmed, and it matches the official number to the bit once the window fills. The history shows the last three minutes. Controls: RESET · PAUSE / RESUME · TARGET (a streaming platform, drawn as a line with the distance to your integrated value).
The 4× true peak has a known maximum under-read (EBU test 3341-17 reads −6.3160 dBTP against a real −6.0): if your master measures −1.0 dBTP here, treat it as a little higher.
02 · How much headroom

DYNAMICS
Not how loud the mix is, but how much headroom is left in it.
PSR = max true peak of the last 3 s − short-term; PLR = max true peak since RESET − integrated (AES TD1004). Below them, the short-term histogram since RESET in 61 bins of 1 LU, and the clip events above a threshold in dBTP (default −1.0, range −3…0) on a 10-minute timeline. An event opens on the first sample over the threshold and closes 100 ms below it: 10 bursts of 50 ms read 10 events. Controls: RESET · PAUSE / RESUME · the threshold — changing it restarts the count.
A steady sine reads PSR = PLR = 0.0 dB, and that is the right answer. The 8 dB line is a reference, not a verdict: the lens never paints your number red.
03 · Where the energy sits

SPECTRUM
The spectrum with an exact dB reference: each bin in dBFS referred to a full-scale sine.
FFT 1 024 – 32 768 · WINDOW FN Hann, Blackman-Harris or Kaiser β=9 · OVERLAP · CHANNEL L · R · M · S · L+R · BANDS free / ⅓-octave ISO 266 (30) / Bark (24) · SLOPE (default 3, so pink noise reads flat; a display transform, and the number under the cursor is the tilted one) · AVERAGE none / exponential τ 0.1–10 s / infinite · HOLD 0–60 dB/s · RANGE · SMOOTHING off / 1/24 / 1/12 / 1/6 octave — a screen setting only: the readout, the peak hold and every number keep reading the raw bins.
Changing the FFT size moves the noise floor, not the tones; and a band with no bin in it is marked differently from a band at zero. For bass, use a big FFT.
04 · How it moves in time

SPECTROGRAM
Level over time: frequency in Y (log, 20 Hz – 20 kHz, 512 rows), time in X with now on the right, level in the colour.
HISTORY 10 / 30 / 60 s · RANGE 60 / 90 / 120 dB · CHANNEL · PALETTE. It uses the instantaneous power, never the averaged one, and each row takes the maximum of the bins in its cell. The FFT settings are SPECTRUM's — the same knob. Changing FFT, overlap, channel, range or history clears the display instead of mixing two mappings; changing only the history does not restart the analysis.
The palette is one setting for four lenses — SPECTROGRAM, STEREO SPECTROGRAM, WATERFALL and FIELD. ovni, inferno and viridis are monotonic in luminance, so brighter always means louder; spectrum orders the level by hue instead.
05 · The same, in depth

WATERFALL
The same data as the spectrogram, in depth: frequency in X, level as height, time in Z with now at the front.
LINES 60 / 90 / 120 · TILT · HISTORY · RANGE. The projection is oblique and drawn in software — a 2.5D view, with no GPU and no divide by z — so the same distance in frequency measures the same at any depth. Occlusion is drawn front to back with a horizon, proven identical to the literal painter's algorithm. If the ring holds fewer columns than the lines you ask for, it draws the ones there are. The readout gives frequency and dB of the front line only.
Height is easier to compare than colour, but a short event can hide behind a later one. Read it next to SPECTROGRAM: they are complementary.
06 · Which notes

CQT
The spectrum by note: constant-Q with 24 bins per octave from A0 (27.5 Hz), one window per bin — 229 bins at 48 kHz.
One bar per bin over a note axis, with a 114-key keyboard drawn to scale underneath, then the chromagram in twelve bars with the tonic in amber and the key. CHANNEL · CHROMA (the chromagram's smoothing: 0.5 / 2 / 5 s). The key is never stated alone: it always carries its confidence and its share of time, because the confidence has a floor and some music is genuinely ambiguous. Silence reports no key.
The bass is late by physics: A0 needs 1.2410 s of listening at 48 kHz, and the lens prints A0 · 1.24 s on screen instead of hiding it.
07 · Octaves at a glance

SPIRAL
The same constant-Q, coiled: one turn per octave, so equal notes land at the same angle.
Angle = pitch class, with C at the top and clockwise; radius = octave, from A0 inside to the highest bin outside; each spike's brightness and thickness follow the level. In the centre, the chroma wheel with the tonic and the key. CHANNEL · CHROMA.
The guide circles mark the radius where octave n starts, not octave n itself: read as rings, they read one octave too much.
08 · How wide, and how it folds to mono

SCOPE
The classic ways of looking at stereo, over a 100 / 300 / 1000 ms window: correlation, width, balance and mono loss.
The mode: LISSAJOUS, an auto-scaled goniometer that says its scale (the edge is the hop's peak); POLAR SAMPLE, the same angle with the radius as level in dB; and POLAR LEVEL, built for mixing — a half-circle with mono at the top and L and R on the base, one ray per degree, the average in time filled and the peak-hold as an outline, and what is out of phase folded onto the base with its percentage. TRIGGER · WINDOW 100 / 300 / 1000 ms · in POLAR LEVEL, PEAK DECAY 12 / 24 / 48 dB/s and LIN / dB. The oscilloscope shows 40 ms.
Folding loses nothing: each out-of-phase direction lands next to where it belongs by panning, and the percentage beside it says how much. It is pan direction by energy — not localisation.
09 · Stereo, band by band

BAND CORRELATION
SCOPE's five sums, per ⅓-octave band (ISO 266, 30 bands).
WINDOW 0.3 / 1 / 3 s — the effective window is published as measured (0.2987 / 1.0027 / 3.0080 s) · ROW (which figure sits on top). The broadband figure computed from the bins agrees with the time-domain meter: correlation within 0.00076, mono loss within 0.0033 dB. A band with no bin in it is marked as unmeasurable, not as zero, and the readout says how many bins measured each band.
Measured on an 80 Hz sine in mono plus out-of-phase noise above 2 kHz: broadband reads corr +0.24, while the 80 Hz band reads +1.00 and the 4 kHz band −1.00.
10 · Phase over time

STEREO SPECTROGRAM
The sonogram with the colour's meaning changed: colour is the phase (per-bin coherence), brightness is the level.
Red out of phase, green wide, white mono. A cell with no energy is black, and silence sits at the centre of the scale, meaning undefined. HISTORY · RANGE · WINDOW. The coherence is smoothed over the window — a single frame over two independent sources would be confetti — but the energy is not: it keeps its time axis.
Both channels are summed for the brightness, so a mono signal reads 3.01 dB above what SPECTRUM shows for the L channel alone.
11 · Energy by pan direction

FIELD
Energy per pan direction × frequency, 64 columns × 96 rows, with decay and a trail, in 2.5D.
Per bin, pan = (ΣRR − ΣLL) / (ΣRR + ΣLL); under the constant-power law it equals −cos 2θ, checked to 4.9·10⁻⁸. DECAY 0.5 / 1 / 2 s · WINDOW 0.3 / 1 / 3 s · PALETTE. The axis reads L … C … R, the readout gives the pan in per cent and the dB relative to the grid's maximum. Under the axis, fixed and impossible to switch off: energy by pan direction · not localisation.
FIELD cannot tell mono from out of phase — both land in the centre. Read it with BAND CORRELATION and STEREO SPECTROGRAM: the three go together.
12 · Against a reference

TONAL BALANCE
What colour your mix is, compared with a reference track you load.
The reference is analysed whole, offline. Both ⅓-octave curves are normalised by their own integrated LUFS, so the lens compares tilt, not level — and the delta sums to zero, checked band by band to 0.006 dB. Above, the two curves on a fixed +6 … −42 dB scale; below, the delta as ±12 dB bars with a labelled ±3 dB reference band, one vertex per band. RESET (keeps the reference) · LOAD (or drag a file onto the lens) · REMOVE.
Add 6 dB above 2 kHz and the delta will not read +6 up top: the loudness rises too, so it draws +1.70 dB above 8 kHz and −4.30 dB below 500 Hz — the same 6 dB, counted at equal volume.
13 · What it concludes

VERDICT
Twelve lenses show; this one says. A deterministic rules engine — 21 rules over a per-second history — where every sentence carries the number that supports it and the id of the rule that produced it.
First a headline with the count, no adjectives — for example 15 checks within range · 3 to look at, the first at 0:20. Then four sections: within range · how it will feel · where it translates · what to check, and where. A finding puts the number first and ends with where to look, never with what to do; a dip across several neighbouring bands is one finding. Without a reference it compares against your material's own trend; with one, against the reference. The six per-device checks are generic definitions of a class of system, not speaker curves. RESET · MODE (live / FILE) · FILE → LOAD. The footer cannot be removed: Measurement, not taste. Device checks are generic. Re-run the analysis after every change.
No findings is not the same as finished. When the rules find nothing it says Nothing outside the ranges of these rules. They measure; what they can't hear is yours. — never ready.
Tips & tricks
01
02
In POLAR LEVEL, the out-of-phase fold is not an alarm. Every mix with decorrelated sources has instantaneous samples out of phase; the colour's emphasis follows the measured mono loss, and the percentage beside the base says how much.
03
Re-run the analysis after every change. VERDICT's times come from its per-second history since the last RESET, and if you open it halfway through a track the report starts there. For exact times over a whole track, use FILE mode.
04
Checking a bounce? Drop it on VERDICT in FILE mode: the offline analysis uses the same classes as the live one and comes out equal to the bit — 60 s of audio in about a quarter of a second on an M4.
05
Read the stereo lenses together: SCOPE for the whole, BAND CORRELATION per band, STEREO SPECTROGRAM over time and FIELD for where the energy sits. FIELD alone cannot tell mono from out of phase.
06
Pick a streaming TARGET in LOUDNESS and its line is drawn across the LUFS bars and the history, with the distance to your integrated value written out.
Troubleshooting
VERDICT says “no complete seconds yet”.
VERDICT works from a per-second history, and no whole second has been analysed yet. Let the track play from the start, or use FILE mode — which is exactly what the message says: no complete seconds yet: let the track play from the start, or use FILE.
TONAL BALANCE says “reference not found”.
A session stores the reference's path, not its numbers. If the file was moved or deleted, the lens says reference not found: with its name and draws no curve, instead of showing saved numbers as if they were still the file. Load it again from where it is now.
With reduced motion on, some lenses stop animating.
TELESCOPE honours the system's reduced-motion setting lens by lens: SCOPE leaves no trail and POLAR LEVEL has no memory, SPECTRUM stops smoothing between frames, and FIELD drops its trail. SPECTROGRAM, STEREO SPECTROGRAM and WATERFALL keep running — their time axis is the data, and freezing them would show less of it.
How do I change the language?
LANGUAGE, at the foot of the lens strip, switches the whole plug-in — all thirteen lenses — and shows each language by its own name. English and Spanish are reviewed; Portuguese, French, German and Italian are translated with the industry's terms and pending review by a native speaker. A missing phrase falls back to English, never to a blank.
macOS warns me about the installer.
It should not: the package is signed with a Developer ID and notarized by Apple, and Gatekeeper opens it with a double-click. If macOS ever warns about this .pkg, do not bypass the warning — download it again from the release and check its SHA-256 against SHA256SUMS.txt.
My DAW lists parameters I can't see in the window.
inGain, output and monoSafe come from the label's shared chassis, which every OVNI plug-in carries. TELESCOPE does not show them because it does not process; at their defaults the audio is bit-exact — which is what the pass-through test verifies.
Specs
Formats: VST3 · AU (macOS 11+, universal)
Latency: 0 samples · bit-exact pass-through
Loudness: ITU-R BS.1770 · EBU Tech 3341 tests 1–5 & 15–19 · Tech 3342 tests 1–4
True peak: BS.1770 Annex 2 · 4× below 96 kHz · 2× from 96 to 176.4 kHz · 1× from 192 kHz
Analysis: on its own thread · file analysis equal to the bit
Channels: mono or stereo in → stereo out · stereo only
Languages: EN · ES · PT · FR · DE · IT
Licence: AGPLv3
Windows: VST3 x64 · Windows 10+ · unsigned ZIP